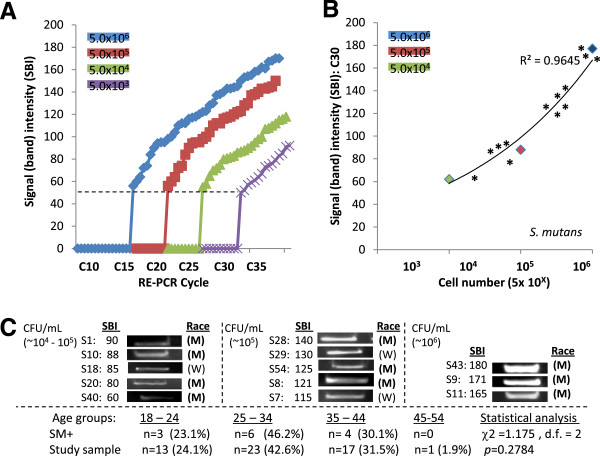
Figure 2 .
RE-PCR using DNA from S. mutans (SM) standards and saliva samples. A) DNA standards obtained from SM samples containing 5.0 x 10³ - 106 CFU/mL established minimum threshold (CT) and saturation (CS) cycles; (high concentration) 5.0 x 10⁶ CFU/mL CT = C15, CS = C40; (low) 5.0 x 136 CFU/mL , CT = C30, CS = 55. B) RE-PCR at C30 (at low concentration CT = C30, below high concentration CS = C40) revealed strong, positive correlations (R2 = 0.9645) between signal band intensity (SBI) and CFU/mL. C) RE-PCR using DNA extractions from all saliva samples revealed (n = 13/56 had elevated SM levels. Plotting the SM-positive sample SBI (*) with the DNA standards revealed samples with moderate to very high caries risk; Very high caries risk (n = 3), high risk (n = 5), moderate risk (n = 5). No significant differences in gender (not shown) or race/ethnicity between SM-positive and overall sample demographics were noted (M = minority, W = white). No statistically significant differences were found among the ages of SM-positive samples and those of the study sample (p = 0.2798).

