
Figure 2. ClC-2 gating at different [H+]i.
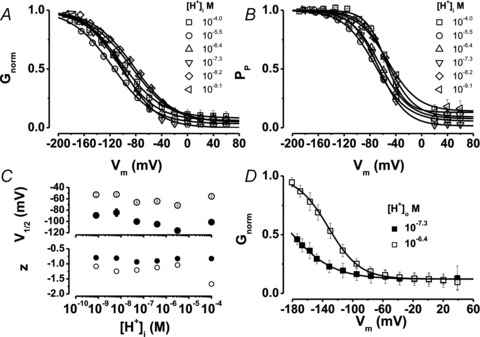
A, Gnorm(Vm) curves at different [H+]i. B, PP(Vm) curves at different [H+]i. [H+]i (in m) and number of experiments were: 10−9.1, 9 (⊲); 10−8.2, 5 (⋄); 10−7.3, 11 (▿); 10−6.4, 11 (▵); 10−5.5, 11 (○); 10−4.0, 7 (□). Continuous lines in A and B are fits with Boltzmann eqn (1). C, estimated V1/2 and z values obtained by fitting with eqn (1) individual Gnorm(Vm) or PP(Vm) curves. Open symbols are parameters for Gnorm(Vm) curves while filled symbols are parameters corresponding to PP(Vm) curves. D, Gnorm(Vm) curves obtained from cells bathed first in a solution with pH 7.3 (filled squares) and then switched to a solution with pH 6.4 (open squares). The [Cl−]i and pHi were 10 mm and 6.4, respectively. [Cl−]o was 140 mm.