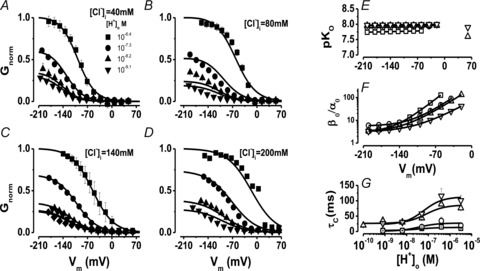
Figure 5. Vm-dependent gating of ClC-2 at different [H+]o and [Cl−]i ions.

A, B, C and D, families of Gnorm(Vm) curves at different [H+]o from cells dialysed with 40 (A, 5 < n < 9), 80 (B, 4 < n < 10), 140 (C, 4 < n < 11) and 200 (D, 4 < n < 8) mm Cl−. [H+]o were: 10−9.1 (▾), 10−8.4 (▴), 10−7.3 (•;), and 10−6.4 m (▪). The [H+]i = 10−7.3 m and [Cl−]o = 140 mm was the same in all cases. Note that Gnorm was >0 when the [H+]o was 10−9.1 m in all cases. Continuous lines are fits with eqn (6) (from Scheme II) used to calculate pKO and βo/α0 ratio. The resulting parameters were: [Cl−]i = 40 mm: B = 2.95, A = 1492, z = −1.02, pKO = 7.8, zh = −0.017; [Cl−]i = 80 mm: B = 5.59, A = 350, z = −0.89, pKO = 7.9, zh = −0.016; [Cl−]i = 140 mm: B = 3.2, A = 255, z = −0.83, pKO = 7.96, zh = 0; [Cl−]i = 200 mm: B = 3.1, A = 68.8, z = −0.71, pKO = 8.0, zh = 0.008. SEM were similar for all Vm and for clarity only high and low [H+]o are included. E, pKO vs. Vm at different [Cl−]i. F, β0/α0 ratio vs. Vm curves for C↔O transition (Scheme II) at different [Cl−]i. Continuous lines are fits using eqn (7) with z = −0.79, −0.75, −0.75 and −1.13 for 40, 80, 140 and 200 mm Cl−, respectively. G, τC vs.[H+]o at different [Cl−]i. Continuous lines are fits with eqn (9). For E, F and G curves [Cl−]i was (in mm): (□ = 40; ○ = 80; ▵ = 140, and ▿ = 200 mm). Triangles and inverted triangles plotted at +60 mV in panel E are pKo values obtained from fitting eqn (9) to data shown in panel G.
