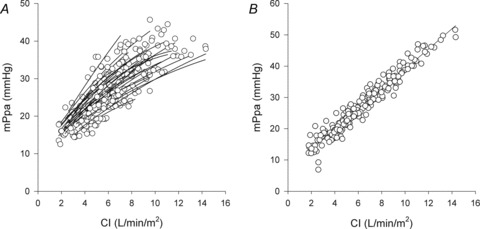
Figure 1. Individual mean pulmonary artery pressure (MPPA)–cardiac index (CI) plots obtained during the incremental exercise test before (A) and after Poon's adjustment (B) for individual variability.

Following Poon's adjustment, the average MPPA–CI slope and intercept were 3.23 mmHg min l−1 and 6.93 mmHg with an R2 value of 0.94.
