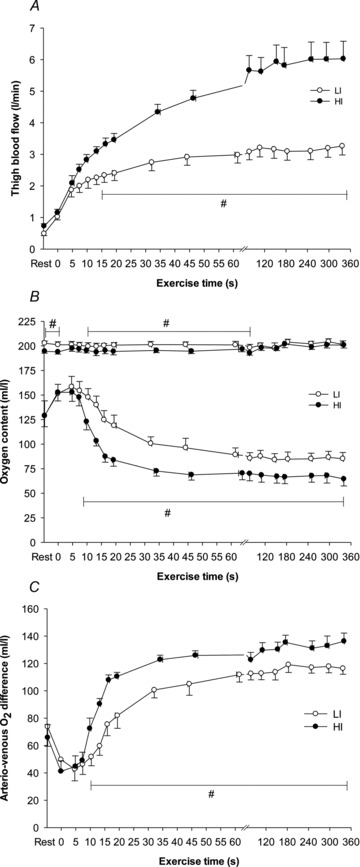
Figure 2. Thigh blood flow (A), arterial and venous O2 content (B) and muscle O2 extraction (C) before and during 6 min of low-intensity (LI, filled symbols) and high-intensity (HI, open symbols) single-legged knee-extension exercise.

Values are mean ± SEM. #LI significantly different from HI.
