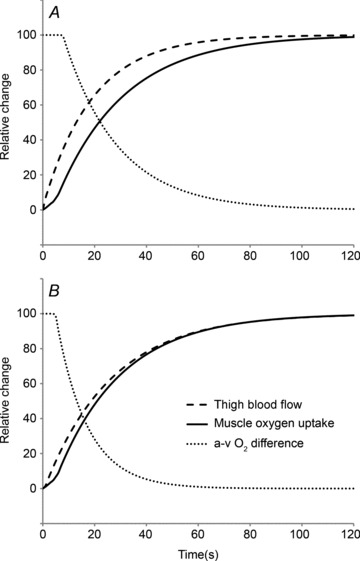
Figure 5. Schematic illustration, based on the group mean model fits, of the relative changes in muscle blood flow, O2 uptake and arterio-venous O2 difference for the initial phase of low-intensity (A) and high-intensity (B) exercise.

Notice that muscle blood flow kinetics are faster than muscle O2 uptake kinetics for low-intensity exercise but that the kinetics of muscle blood flow and muscle O2 uptake are similar for high-intensity exercise. Notice also that the arterio-venous O2 difference falls more rapidly following the onset of HI compared with LI exercise.
