
Figure 5. Leg hyperaemia induced by passive leg movement in healthy individuals and individuals with peripheral arterial disease (PAD).
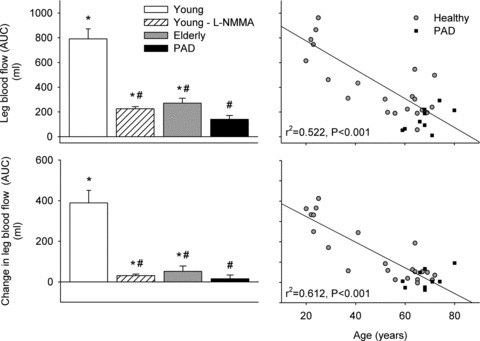
Leg blood flow and the change in leg blood flow from baseline to passive leg movement in young and elderly healthy subjects and patients with peripheral artery disease (left). Individual leg blood flow response and the changes in leg blood flow expressed in relation to age (right). Area under the curve (AUC) was calculated from continuous Doppler tracings during 90 s of passive leg movement. Displayed correlations are for healthy subjects. *Significantly different from baseline, P < 0.05; #different from young subjects, P < 0.05.