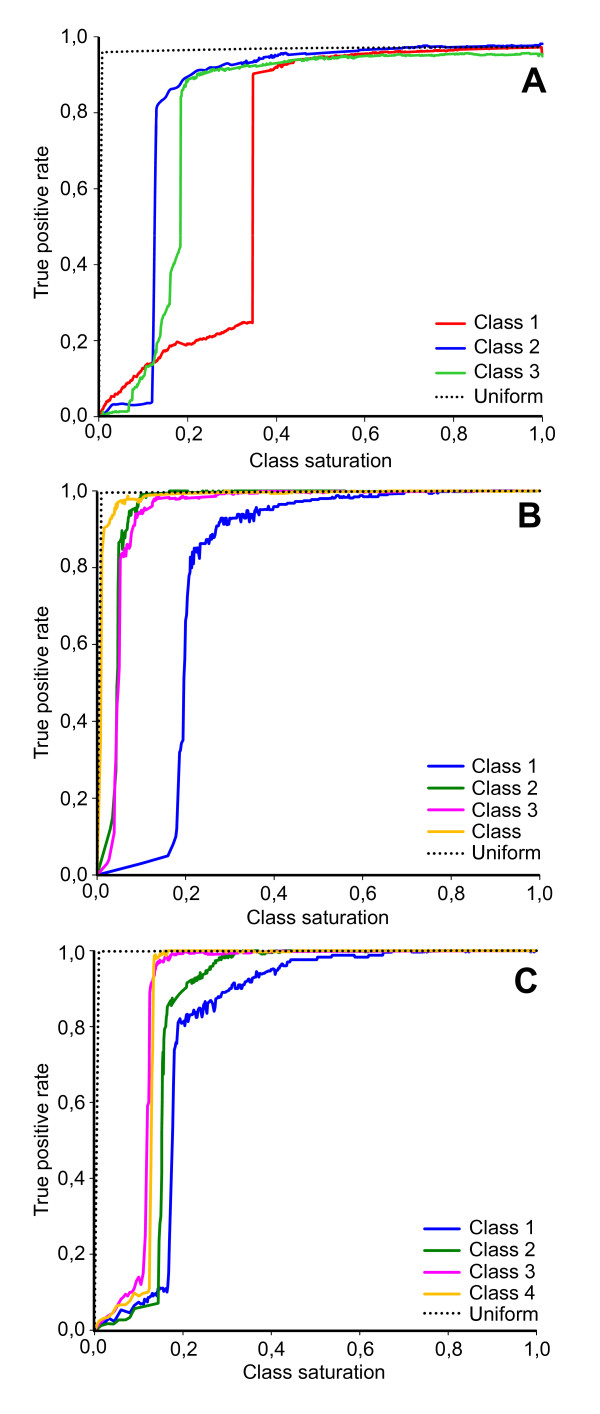
Figure 14.
Limits of classification capability for the simulated and real datasets.A - ROC graph showing the performance of the FCM-classifier during balanced (dotted line) and unbalanced modification (solid lines) of classes in the simulated dataset; B – the same for the real dataset A; C - the same for the real dataset B.

