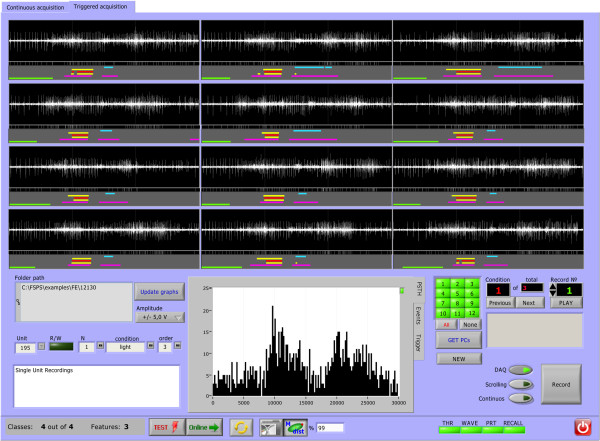
Figure 2.
Interface window for triggered data acquisition and visualization. An offline module of the FSPS programme shows the acquired signal and consents instant acquisition of the two first Principal Components (PC1 and PC2, after full SVD) for each triggered acquisition session. Here we showed the organization of the user-interface window with neural polyspikes acquired during twelve triggered sessions of goal-directed movement in a monkey. Raw data from the electrode and additional digital hardware information were retrieved and visualized (as shown under each session). The resulting histogram of spike occurrence (on the basis of external hardware threshold discriminator) is shown below the trials. The protocol information used later for the analysis is shown to the left of the histogram, while the control buttons to start, stop, overwrite and scroll the trials is shown to its right.

