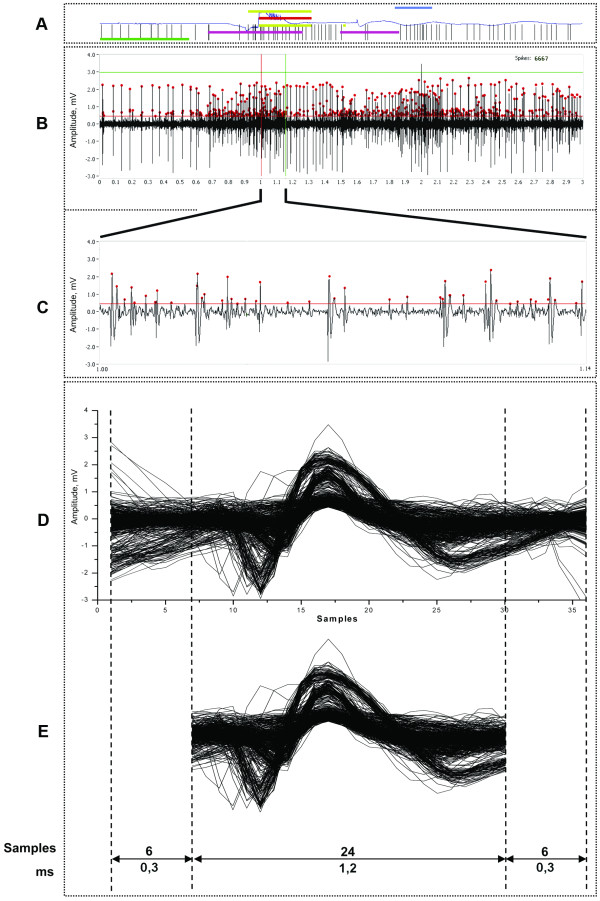
Figure 4.
Visualization of raw signal and collection of spike waveforms.A - information covering each trial of movement execution to monitor the uniformity of trials, where black vertical hatches represent spike occurrence detected using external hardware threshold discriminator; blue line is the infrared signal from the analogue IR-pair; thick coloured horizontal lines are retrieved from the set of digital sensors representing different kinematic parts of executed movement. B - the visualization of one trial in 3 sec multi-unit recordings, where spikes determined by software discriminator are marked with red dots. C - an expanding view of the same raw signal, in which the presence of different kinds of spikes is evident; D - extracted 1.8 ms of spikes waveforms, aligned to the peak of action potential by spline interpolation method; E - the same waveforms with 6 truncated samples at the ends, yielded 1.2 ms waveforms to be filled by the data matrix.

