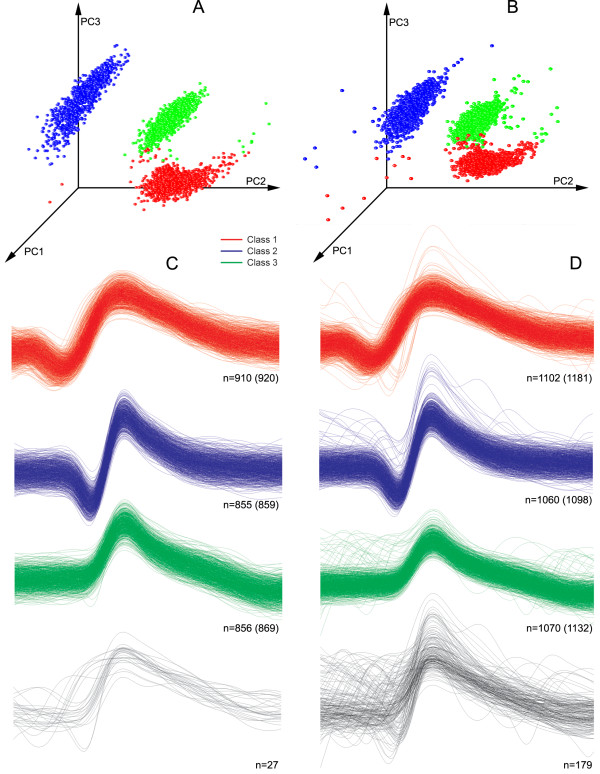
Figure 8.
Result of classification of the simulated dataset from Example 2, noise level 0.15.A - The projection of the first three PCs of the dataset not containing overlapping spikes; B - the same, but with overlapped spikes. Three dense clusters are shown in both cases. C and D - original spike shapes of detected clusters in the datasets without and with overlapping spikes, respectively. Different spike events are shown in different colours, according to the outcome of the clustering algorithm. The number of correctly identified spikes is indicated. Values in brackets indicate the total number of spikes in each class. The spike shape shown in the lower part of the figure has been incorrectly classified and therefore marked in black.

