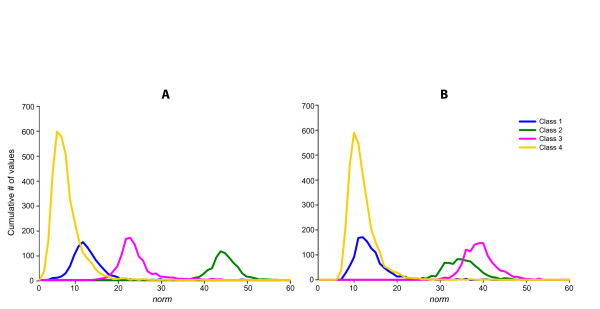
Figure 9.
Distribution of-norm values of input singular vectors for every Class. This figure shows the frequency distribution of -norm values of singular vectors for each determined class in datasets A and B, respectively. Different classes are shown in different colours, according to the outcome of the clustering algorithm.

