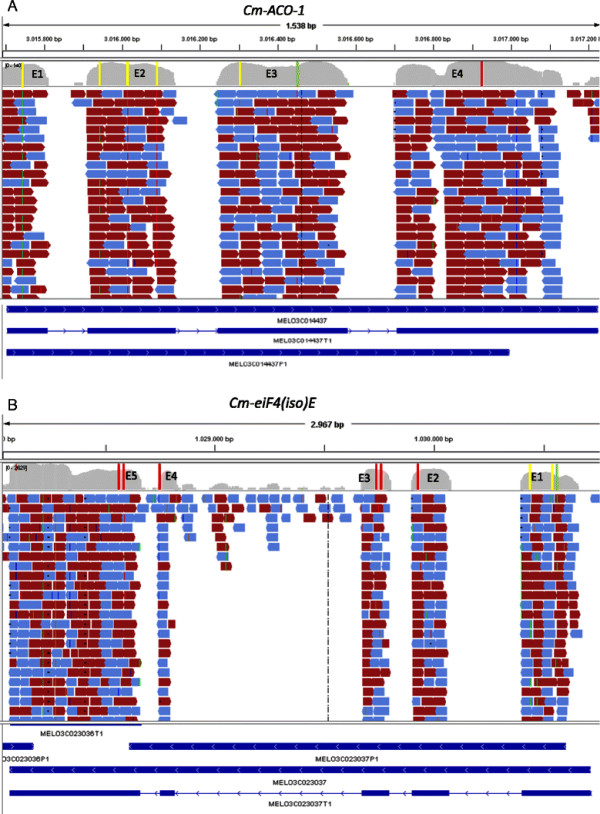
Figure 3.
SNPs detected in the coding region of Cm-ACO-1 (A) and Cm-eiF(iso)4E (B). Short reads generated by SOLiD in the different pools are represented mapped to the genomic sequence (whole genome draft version 3.5 available in MELONOMICS) of both genes. Coverage in exonic and UTRs regions is shown for each nucleotide. SNPs detected by SOLiD and EcoTILLING are represented by colored bars in the different exons (red, green and yellow for mutations detected only by SOLiD, only by EcoTILLING and by both methods). The structure of each gene as annotated in the genome is shown below. Data are visualized with IGV (Integrative Genomics Viewer)[65].

