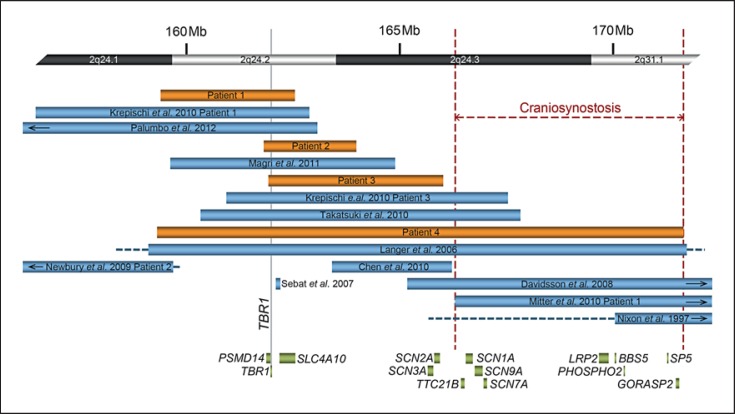
Fig. 1.
Overview of molecularly defined deletions within 2q24.1q31.1. Schematic of cases in the literature (shown in light blue) with deletions characterized by molecular cytogenetic techniques and those in patients 1–4 (shown in orange). At the top of the figure there is a partial idiogram showing chromosome bands 2q24.1q31.1, with genomic coordinates corresponding to the hg18 build of the human genome. Blue and orange bars represent minimum deletion sizes, and horizontal dashed lines extend to show maximum deletion sizes. Genes of note within the region are represented by green bars. The vertical gray solid line indicates the location of TBR1. The largest possible region of overlap among individuals with craniosynostosis is bordered by red dashed lines.

