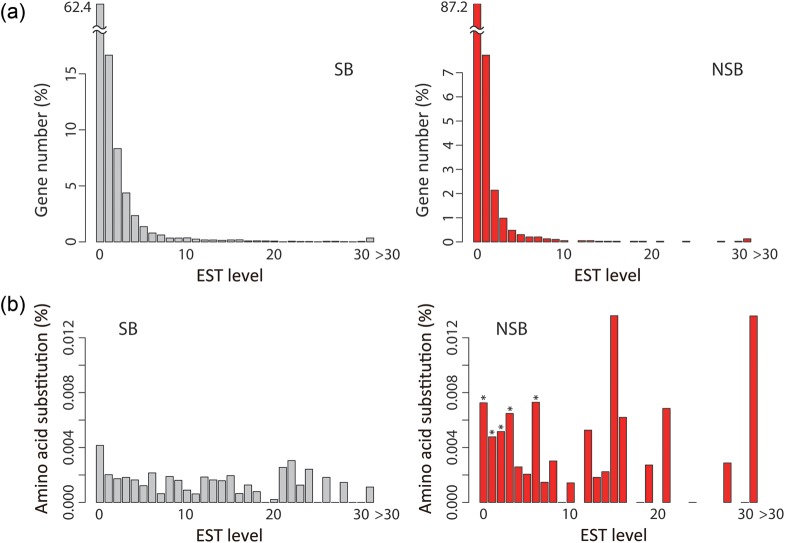
Figure 5.
Gene number and averaged amino acid substitution ratios within SBs and NSBs of strain RIB326 against gene expression levels. (a) Gene numbers and (b) averaged amino acid substitution frequencies within SBs and NSBs are plotted against the level of EST. The P-values for the difference between the amino acid substitution ratios within SBs and NSBs were evaluated using the Wilcoxon signed-rank test for each EST level that included greater than four genes. Asterisks indicate a P-value of <0.05 in the graph of NSBs.

