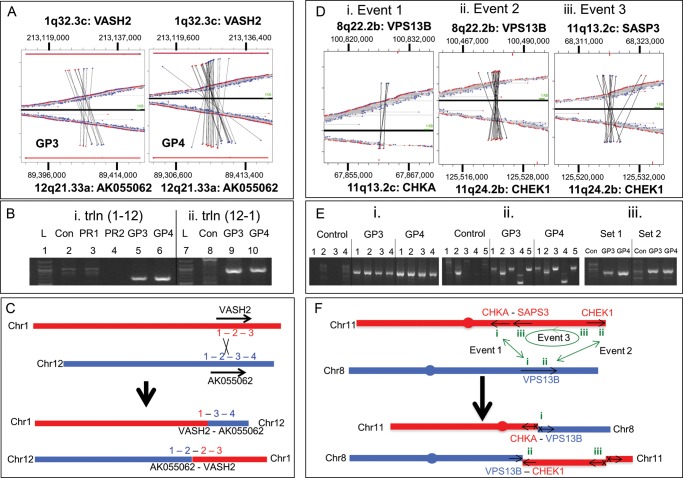
Figure 3.
Validation of chromosome translocation events: mapping of two independent translocation events are depicted; a balanced translocation between chromosomes 1 and 12 (a–c) and a complex rearrangement between chromosomes 8 and 11 (e and f). (a) MP sequences mapping to chromosomes 1 and 12 for GP3 and GP4 are depicted above and below the zero axis, respectively, as red or blue dots dependent on the direction of the sequence read mapping to the reference genome. Horizontally linked red and blue dots closest to this axis depict normal mapping MP sequences to chromosome 1 or 12 alone. MP sequences linked vertically depict translocations between these two chromosomes. (b) PCR validation using primers specific to the t(1-12) event (i) for GP3 and GP4 (lanes 5 and 6) and the t(12-1) event (ii) for GP3 and GP4 (lanes 9 and 10). gDNA (lanes 2 and 8) and different prostate tumour tissues (PR1 and PR2, lanes 3 and 4) were used as controls together with 1 kb ladder (lanes 1 and 7). (c) Schematic representation of predicted VASH2 and AK055062 fusion products resulting from the translocation events described. (d) Mapping of MP sequences to three inter-linked events at genomic loci 8q22.2b, 11q13.2c and 11q24.2b. Events 1 and 2 describe two t(8-11) translocation events linking VPS13B to CHKA (i) and CHEK1 (ii), respectively. Event 3 describes an r(11-11) intra-chromosomal rearrangement linking CHEK1 with SASP3 (iii). (e) PCR validation 1% agarose gels are presented for four different primer sets (1–4) for event 1 (i), five different primers sets (1–5) for event 2 (ii) and two primer sets (1 and 2) for event 3 (iii) for the GP3 and GP4 WGA DNA and gDNA as control. (f) Schematic representation of the three fusion events on chromosome 8 (red) and 11 (blue), describing the potential products and the impact on the gene regions involved. Arrows describe the coding direction of the genes and an X represents the loss of the promoter regions.

