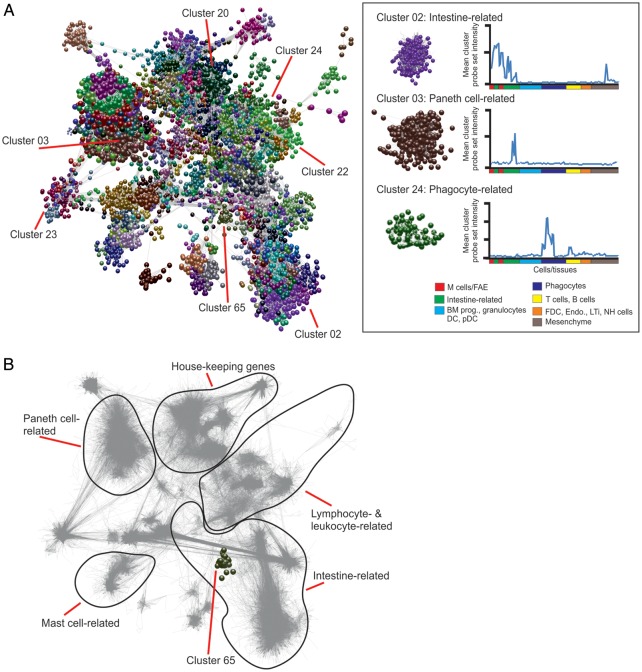
Figure 2.
Network analysis of mouse cell and tissue transcriptomics data. (A) Main component of the network graph derived from 130 samples of mouse cell and tissue populations run on Affymetrix MOE430_2 arrays. Nodes represent transcripts (probe sets) and the edges represent correlations between individual expression profiles above r ≥ 0.85. The boxed area (right) shows three representative clusters derived from the network graph and their mean probe set expression profile across all data sets. BM prog., bone marrow progenitor cells; DC, dendritic cell; pDC, plasmacytoid DC; FDC, follicular dendritic cell; Endo., endothelium; LTi, lymphoid tissue-inducer cells; NH, natural helper. (B) Shadow image of the network graph (edges only indicated by grey lines) with the boundaries of distinct transcriptional networks with related function indicated. Cluster 65 (FAE and Peyer's patch M cell-related) is highlighted.

