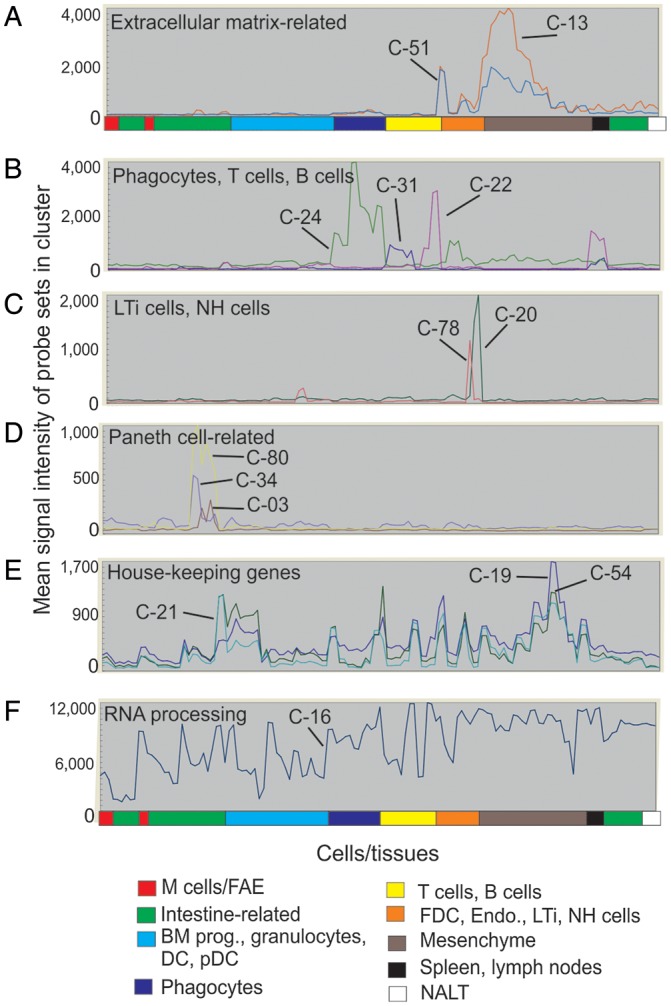
Figure 3.

The average expression profiles of the genes in selected clusters over the 130 samples. x-axis shows samples, grouped according to the cell type (in order of presentation in Supplementary Table S1). y-axis shows mean signal expression intensity for the cluster (probe set intensity). Expression profiles of: (A) extracellular matrix-related gene clusters (cluster 13, red; cluster 51, blue); (B) phagocytes (green, cluster 24), B cells (red, cluster 22) and T cells (blue, cluster 31); (C) LTi cells (red, cluster 78) and natural helper cells (green, cluster 20); (D) Paneth cells (red, cluster 3; blue, cluster 34; yellow, cluster 80); (E) house-keeping (e.g. cell cycle) genes (dark blue, cluster 19; light blue, cluster 21; green, cluster 54); (F) RNA processing genes (cluster 16).
