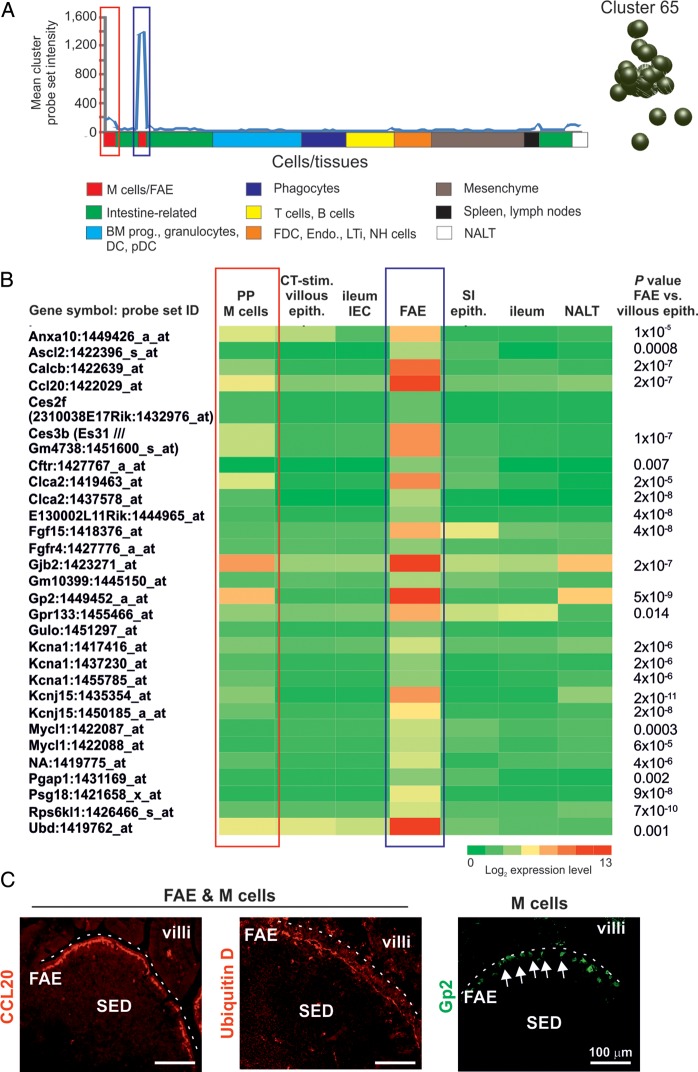
Figure 4.
Expression profiles of the genes within cluster 65. (A) The mean expression profile of the probe set intensities within cluster 65 over the 130 samples. The red-boxed area indicates the Peyer's patch M cell data sets; the blue-boxed area indicates the FAE data sets. The cluster 65 nodes derived from the network graph are also shown. (B) Heat map showing the mean expression of all probe sets within cluster 65 in samples from enriched Peyer's patch M cells (PP M cells), CT-stimulated villous epithelium (CT-stim. villous epith.), ileum epithelial cells (ileum IEC), FAE, SI epithelium (SI epith.), ileum and NALT. Each column represents the mean (log2) probe set intensity for all samples from each source (n = 2–4). P-values for those genes which were expressed significantly within the FAE at levels >2.0-fold when compared with the villous epithelium (ileum IEC, SI epithelium, ileum) are indicated. (C) IHC confirmation of the expression of proteins encoded by FAE-related genes (CCL20 and ubiquitin D, red) and M cell-related (GP2+ cells, green, arrows) in mouse Peyer's patches. SED, subepithelial dome. Dotted line indicates the luminal surface of the FAE.

