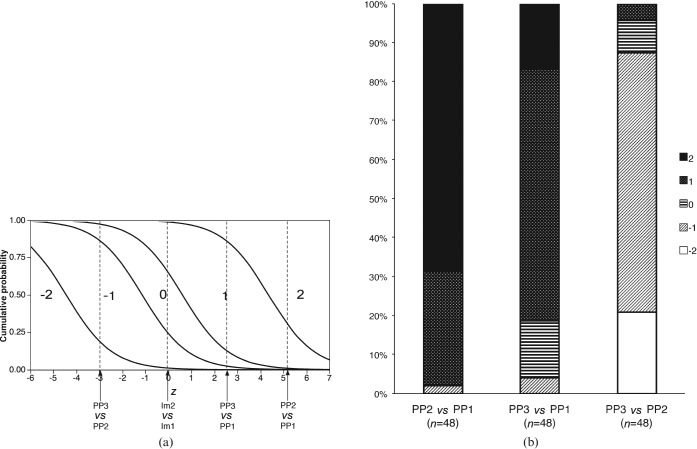
Figure 3.
(a) Graph of predicted cumulative probabilities according to an ordinal logistic regression model applied to the image-pair grading experiment in Tables 3 and 4. The dashed vertical lines represent the predictions for each pair of imaging equipment (Im) and post-processing techniques (PP). The length of each vertical line segment between two curves corresponds to the predicted probabilities for a particular score. (b) Observed relative frequencies of scores for each pair of post-processing techniques. In cases with opposite order of the two images within the pair (left and right exchanged), the sign of the score has been inverted to ensure consistent meaning of each score.

