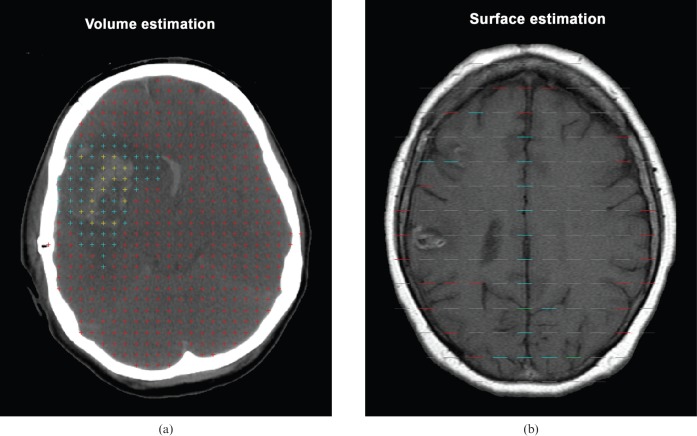
Figure 3.
Stereological grids. (a) Points used for volume estimation (Cavalieri's method). All brains were divided into unaffected tissue (red), lesion (turquoise) and haematoma (yellow) and were counted simultaneously. (b) Test lines used for surface estimation. All intersections between the borders of neocortical matter and the test line were counted. Red = one intersection; turquoise = two intersections; and green = three intersections. It was assumed that there was isotropy.

