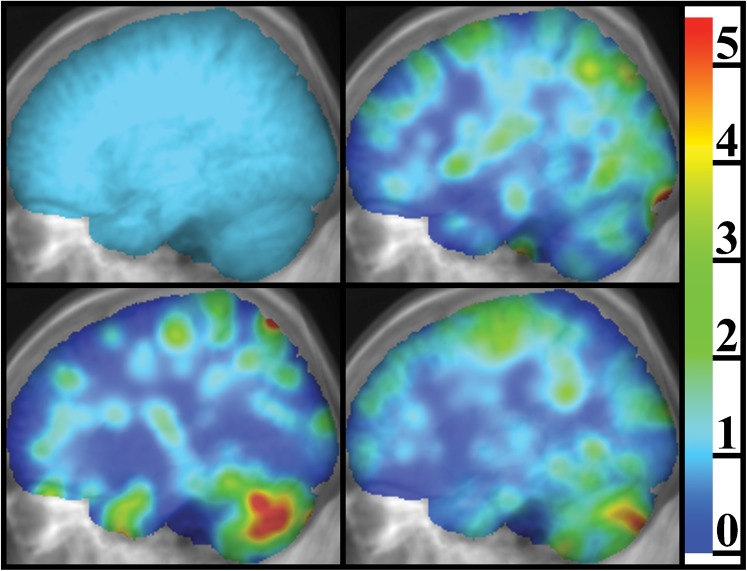
Figure 1.
Lateral projections of brain metastasis atlases, as an overlay on the projection of the MRI image set on which the atlases are defined, illustrating the difference found between different disease types in terms of the prevalence of metastases in certain regions. The colour scale represents the relative prevalence of brain metastasis, which has been saturated at 5.5 for this figure. The image in the top left panel is the case for a hypothetical uniform distribution of brain metastases used for comparison with the other panels; in this image the relative prevalence of brain metastasis is equal to one everywhere by definition. The top right panel is for renal and gynaecological malignancies in addition to melanoma. The lower left panel is for breast cancer and the lower right panel is for lung cancer (both small cell and non-small cell).

