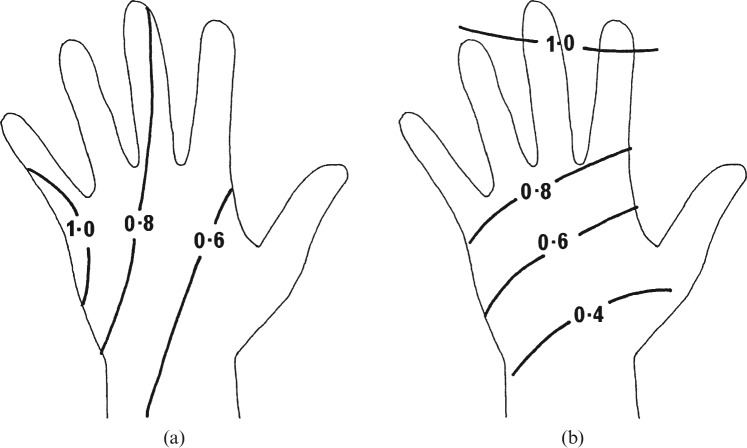
Figure 1.
Diagrammatic representations of the distributions of dose across the left hand based on data from thermoluminescent dosemeter studies for (a) interventional procedures using femoral access and (b) percutaneous procedures relative to the dose recorded at the ring position on the little finger taken from [16]. In both cases the left hand is assumed to be closest to the X-ray tube and image intensifier. Reproduced with permission from Oxford University Press.

