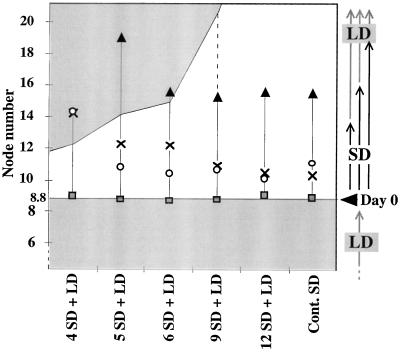
Figure 4.
Progression to flowering in nodes initiated after transfer to SD conditions. Control plants grown under continuous SD conditions and plants transferred to LD conditions after different periods of SD induction after initial growth in LD conditions until d 0 were as in Figure 2. Ten plants for each treatment were analyzed and the lowermost nodes exhibiting different inflorescence traits were recorded: Shaded box, type-2 flower; ○, modified leaf; ×, absence of internode above; ▴, leaf having petal pigmented sectors. ses varied between 0.18 and 0.52 and were higher for the measures of the lowermost node not followed by an internode or with a modified leaf after 4 SD + LD and the lowermost nodes with a leaf containing petal pigment after 5 SD + LD and continuous SD (0.70, 1.10, 1.47, and 0.8, respectively). The areas corresponding to nodes initiated under LD conditions before transfer to SD conditions (below the d-0 mark [Day 0]) or after transfer from SD conditions are shaded. The area corresponding to nodes initiated under SD conditions is left blank.

