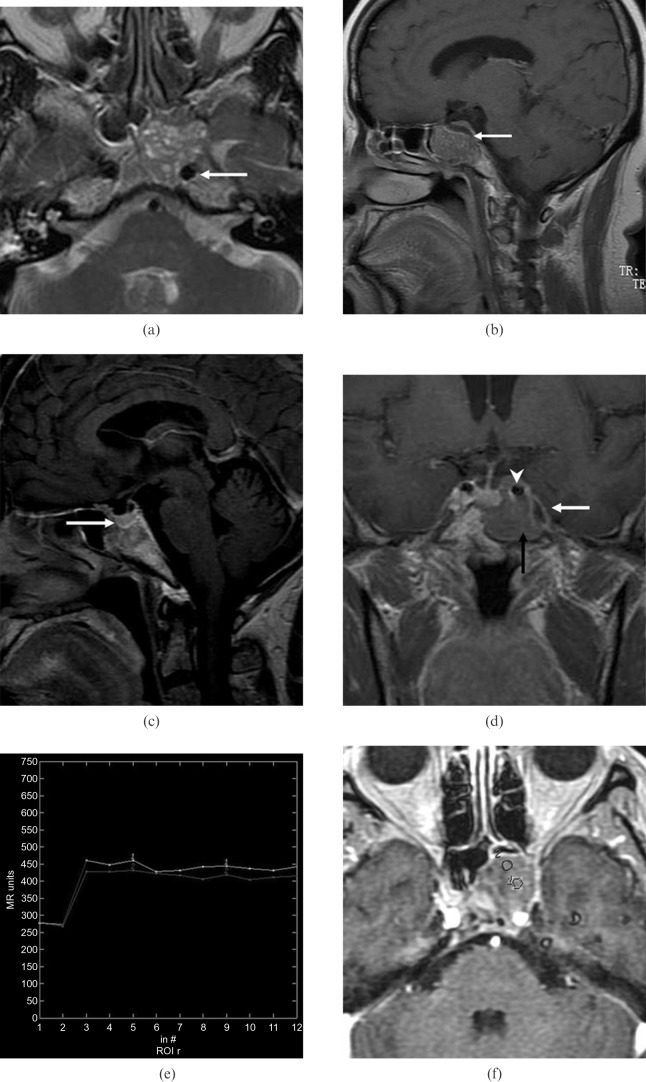
Figure 2.
(previous page) Patient 1. (a) Axial T2 weighted MR image shows a sphenoid sinus mass of slightly high signal intensity with multiple foci of high signal intensity in the cystic spaces. Note the encasement of the left internal carotid artery (arrow) and compression of the adjacent clivus. (b) Paramidline sagittal contrast-enhanced MR image shows mild heterogeneous tumour enhancement exhibiting a cribriform pattern. Note the mild remodelling of the clivus and continuity of the sellar floor (arrow). (c) Midline sagittal contrast-enhanced MR image shows an intact sellar floor (arrow). (d) Coronal contrast-enhanced MR image shows tumour in the left sphenoid sinus (black arrow) involving the left carotid artery (arrowhead) and left cavernous sinus (white arrow). Note the normal enhancing pituitary gland. (e) Corresponding axial dynamic contrast-enhanced MR image depicts the rapidly enhancing and slow washout pattern (Type 2). (f) The two round cursors mark the region of interest selected for signal intensity measurement on dynamic MRI.

