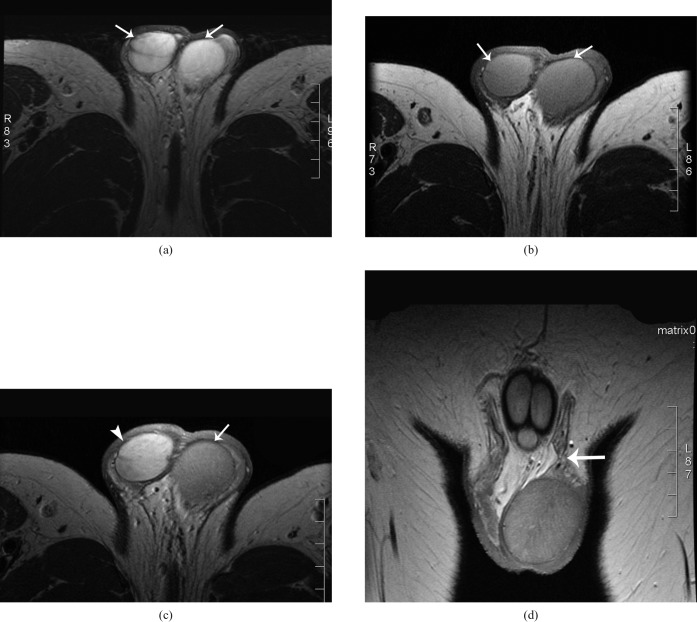
Figure 2.
(a) Axial T2- and (b) T1-weighted MR images demonstrating homogenous high T2 and homogenous intermediate T1 signal intensity in both testes (arrows). (c) Axial T1-weighted MRI image following administration of IV gadolinium showing decreased enhancement of the left testis (arrow) compared to the right (arrowhead). (d) Coronal T1-weighted MRI image demonstrating torsion of left spermatic cord (arrow).

