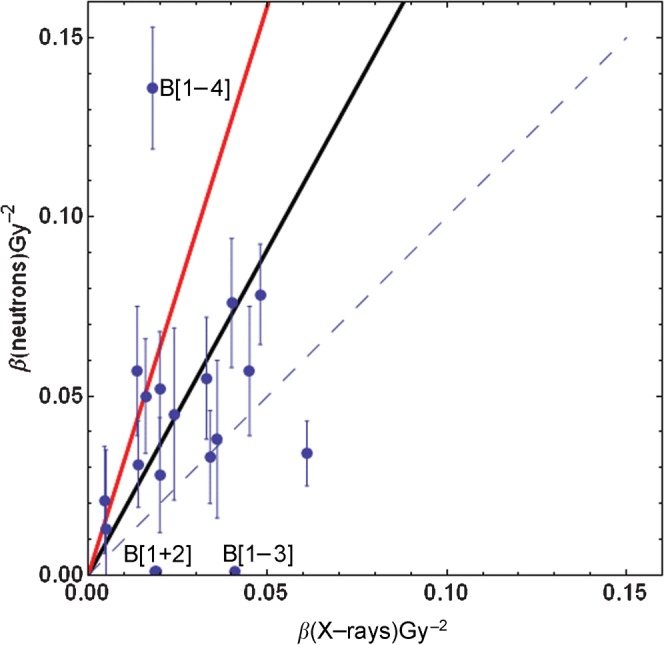
Figure 1.

A plot of mean β values (with standard errors) for 4 MeV megavoltage X-rays and 62.5 MeV fast neutrons published by Britten et al [8]. The dashed line indicates no change (βH = βL); the red line is the fit for all data points (Group A); and the black line is the fit for Group B. Note that there is a superimposition of two data points in the apparent point, which has the lowermost value of β (X-rays) and is labelled B [1+2]. The censored data points for Group B are B [1–4] and one further cell line that cannot be displayed because β was 0.77 Gy−2 for neutrons in the AT5 line. Standard errors were not measurable for the three very low β estimations points for B [1–3].
