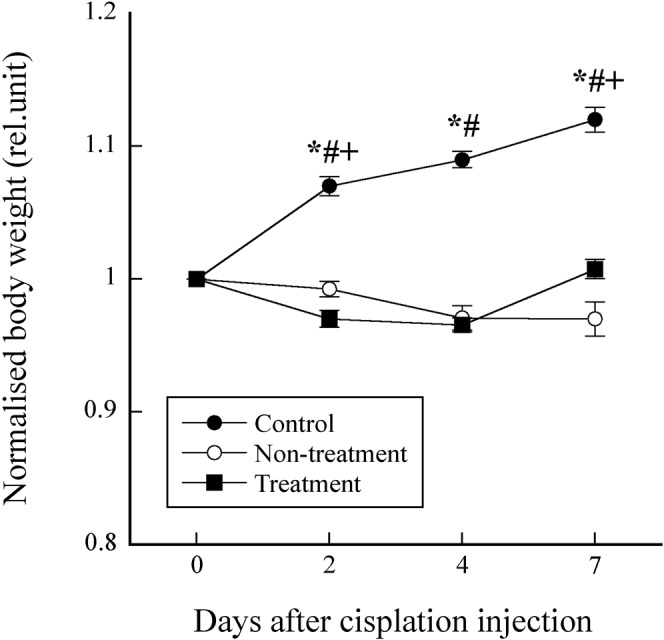
Figure 3.

Body weight normalised by that on day 0 as a function of days after cisplatin injection in the control, non-treatment and treatment groups. Symbols *, # and + indicate significant differences (p <0.05) between the control and non-treatment groups, between the control and treatment groups, and between the non-treatment and treatment groups, respectively.
