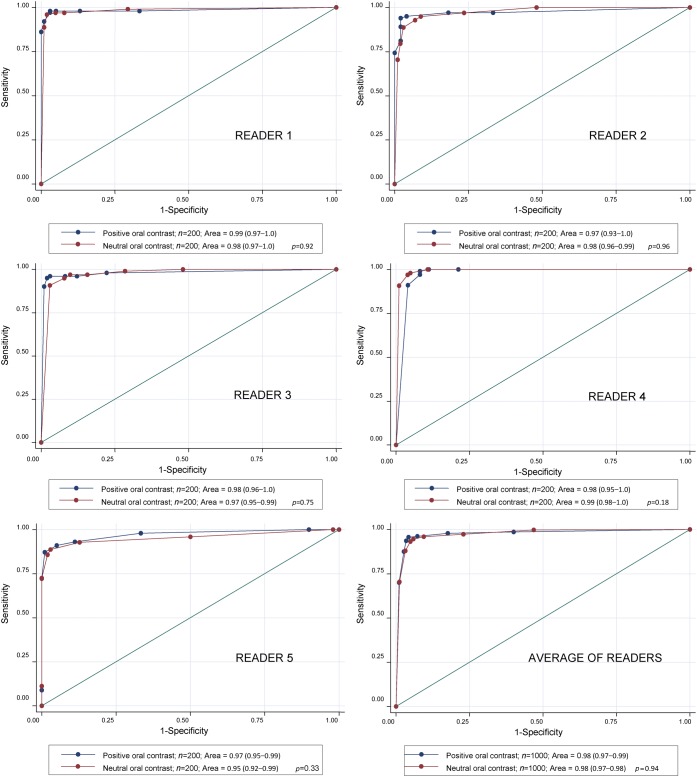
Figure 3.
Receiver operating characteristic curves for all readers and for the average of the readers. 2 curves were generated for each reader, 1 using data from the 200 patients who received positive oral contrast and 1 from the 200 patients who received neutral oral contrast. Areas under the curve, 95% confidence intervals and the p-value comparing the areas under the curves are reported in each legend.

