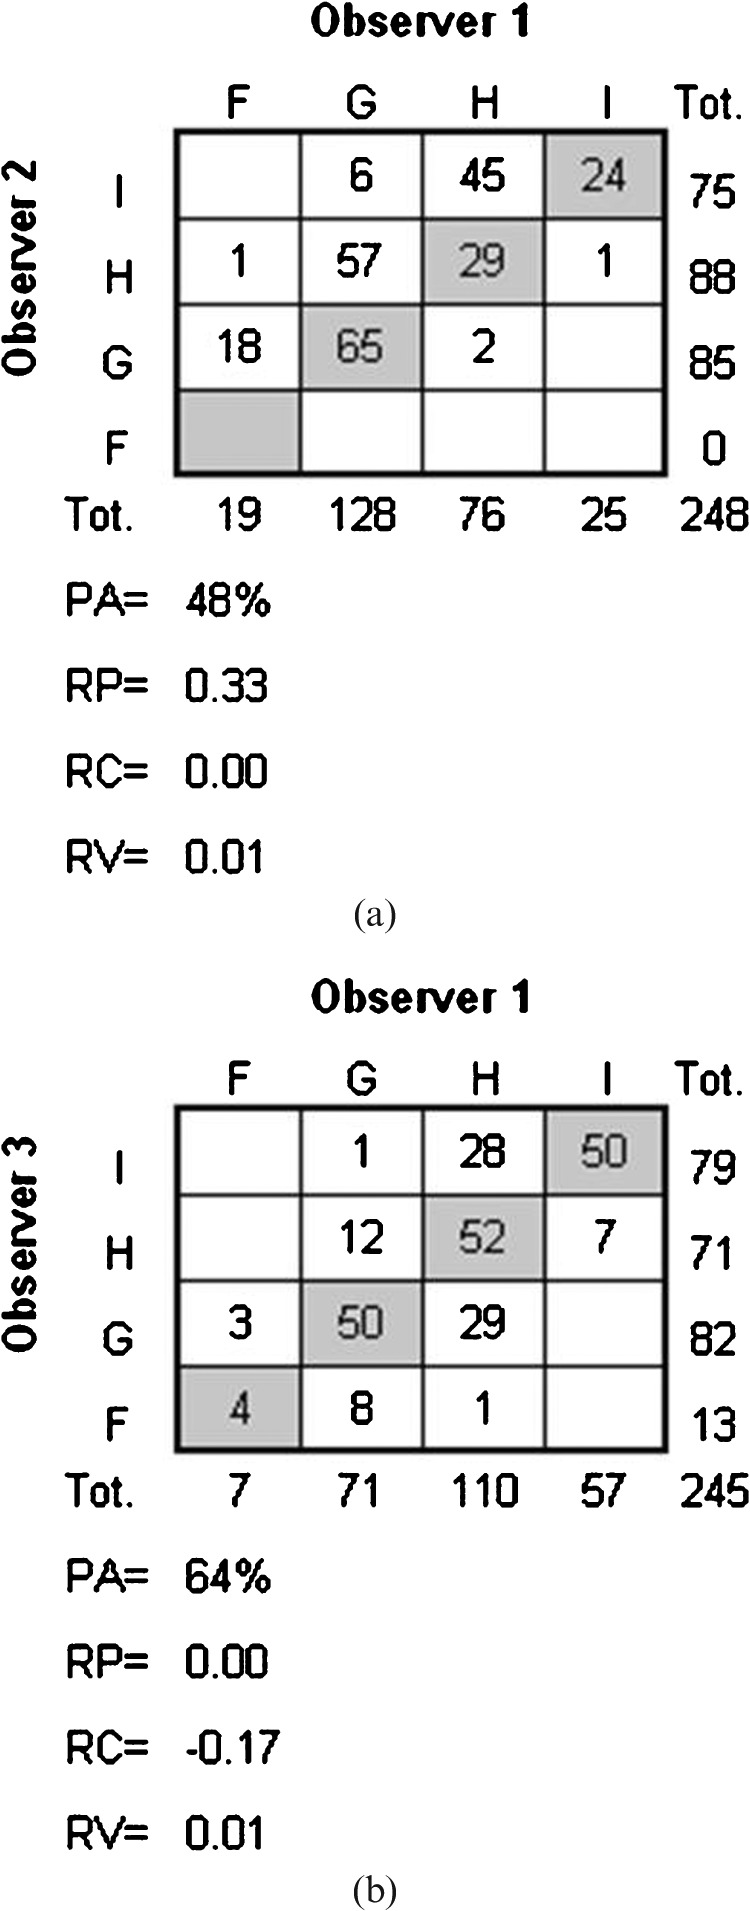
Figure 2.

The frequency distribution of interobserver assessments with corresponding values of systematic disagreement in relative position (RP) and in relative concentration (RC), the measure of additional individual variability in assessments (RV) and percentage agreement (PA). (a) The distribution of assessments made by Observer 1 and Observer 2 regarding Q6 in the upper level of the brain (n = 248), and (b) the distribution of assessments made by Observer 1 and Observer 3 regarding Q2 in the upper level of the brain (n = 245).
