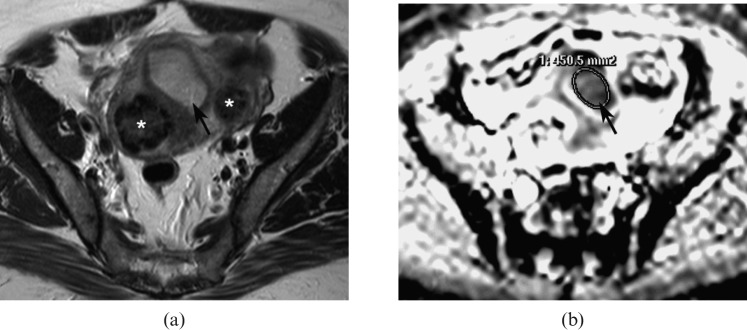
Figure 1.
(a) Axial T2 weighted image showing an intermediate signal intensity endometrial carcinoma expanding the endometrial cavity (arrow). (b) Apparent diffusion coefficient (ADC) map at a corresponding level showing the low signal intensity tumour (arrow). The largest possible region of interest (ROI) is drawn around the tumour on the ADC map without contamination from adjacent normal endometrium or myometrium. *Fibroid.

