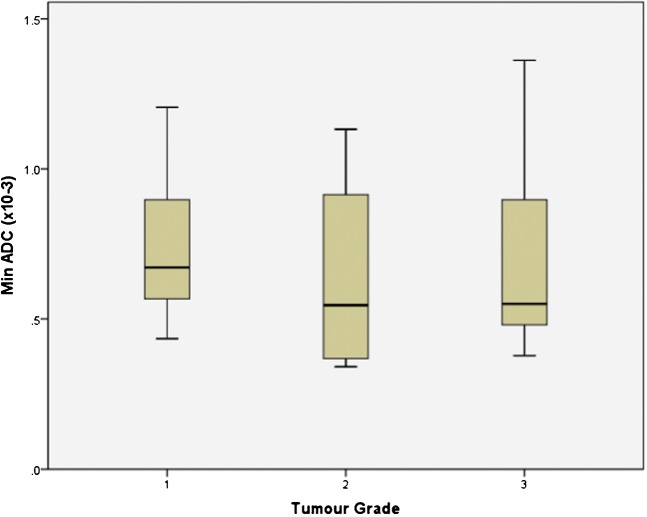
Figure 5.
Box-and-whisker plot showing the minimum apparent diffusion coefficient (ADC) values (×10−3 mm2 s−1) for different grades of endometrial carcinoma. The central horizontal line within the box represents the mean value; the bottom and top edges of the box indicate the 25th and 75th percentiles and the vertical line indicates the range of the data. The minimum ADC value for endometrial cancer showed a trend for being lower in grade 3 tumours than grade 1; however, this did not reach statistical significance.

