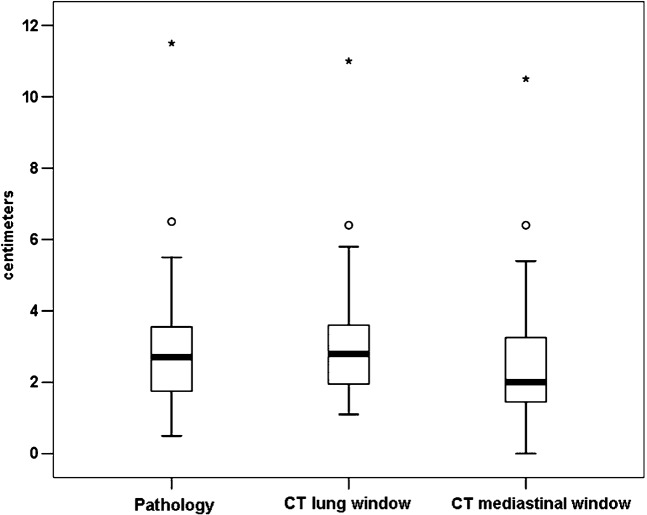
Figure 1.
Box-plot display of the sizes measured on the post-operative histopathology specimen (HP), lung window (LW) and mediastinal window (MW) settings of the CT scan. The central box represents values from the lower to the upper quartile (25 to 75 percentile). The middle line represents the median. The vertical line extends from the minimum to the maximum value, excluding outside (circle) and far outside (asterisks) measurements. There is no difference between HP and LW (p = 0.18), but a significant difference is seen between HP and MW sizes (p<0.0001).

