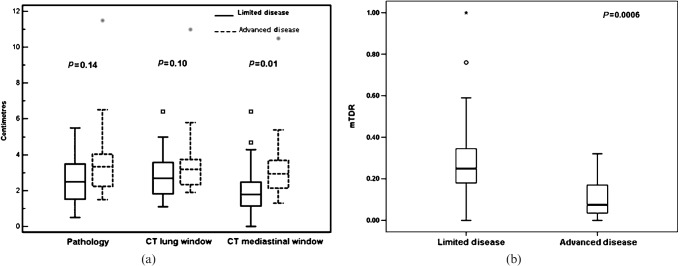
Figure 5.
Box-plot displays for (a) histopathological (HP), lung window (LW) and mediastinal window (MW) sizes and (b) modified tumour shadow disappearance rate (mTDR) in patients with limited disease and in patients with progressive disease. The central box represents values from the lower to the upper quartile (25 to 75 percentile). The middle line represents the median. The vertical line extends from the minimum to the maximum value, excluding outside (small box/circle) and for outside (grey diamond/asterisk) measurements. Unlike HP and LW sizes, MW and mTDR sizes showed a significant difference between the two groups.

