
Figure 2.
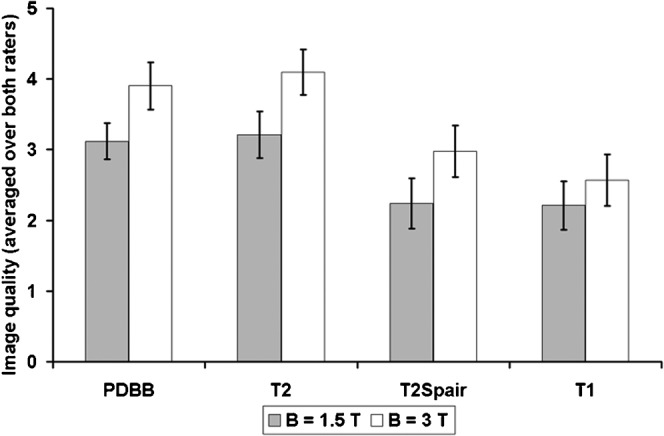
Ratings of image quality. Bars display mean ratings of image quality averaged over the two raters; error bars represent 2 times the standard error of the mean (≈95% confidence interval). All 3 T sequences were rated superior over 1.5 T. PD- and T2 weighted sequences achieved best ratings in both modalities. PDBB, proton density black blood.