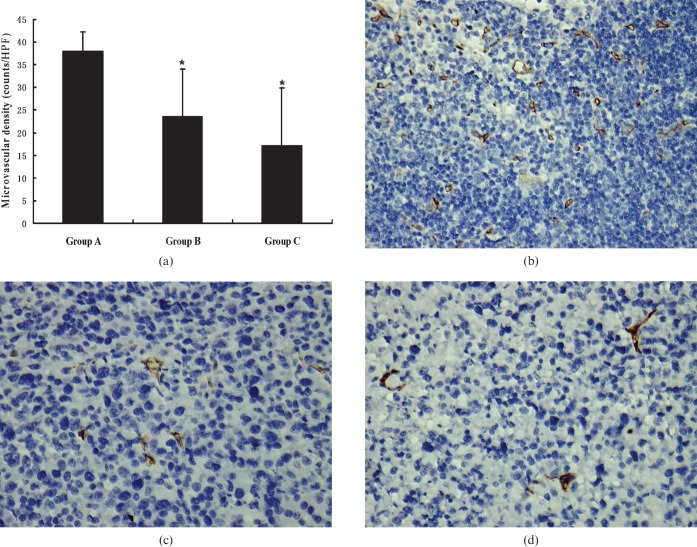
Figure 3.
(a) The graph shows the mean microvascular density (MVD) of each group. *p<0.05, tumours of Groups B and C had significant decreases in MVD compared with that of Group A. Representative photomicrographs of immunohistochemical stained sections of tumours from (b) Group A, (c) Group B and (d) Group C. Group A, control tumours; Group B, tumours treated with low-dose (100 mg kg–1) thalidomide; Group C, tumours treated with high-dose (200 mg kg–1) thalidomide. (CD34, original magnification, ×400).

