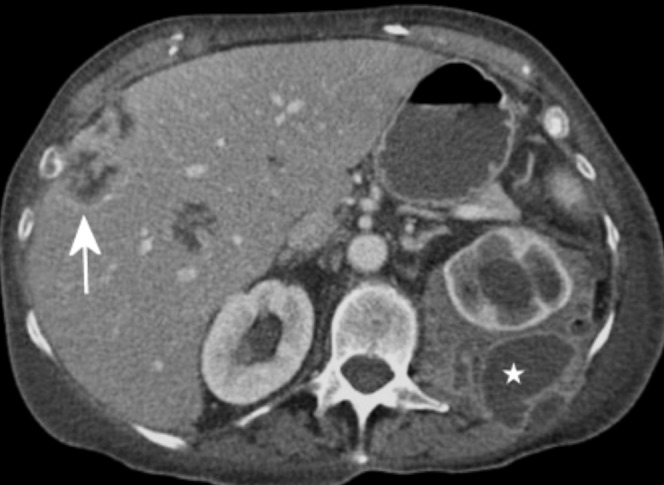
Figure 3.

Contrast-enhanced CT (150 ml at 2.5 ml s–1) showing portal venous enhancement of the liver with low-density lesions within the parenchyma that were later confirmed to be liver metastases (arrow). Also note the left retroperitoneal necrotising collection (star).
