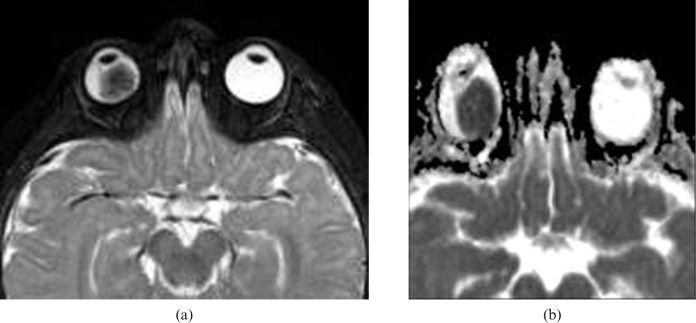
Figure 2.
Retinoblastoma (RB). (a) Axial T2 weighted image shows low signal intensity and a right intraocular mass with few signal void calcified regions. (b) Apparent diffusion coefficient (ADC) map shows restricted diffusion of the lesion with low ADC value (image courtesy of Dr Mauricio Castillo).

