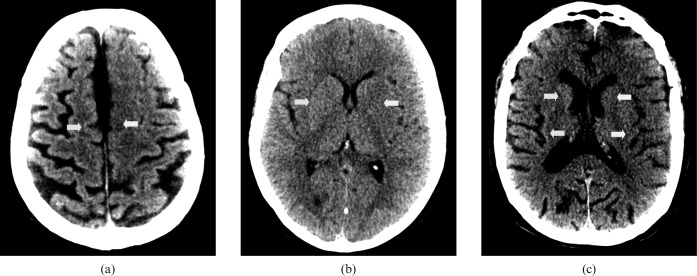
Figure 2.
Harsh “stroke” window settings on review the following day of the same patients as Figure 1 (a), (b) and (c). The visualisation of local cytotoxic oedema secondary to anoxic damage (white arrows) is clearly increased. The corresponding contralateral unaffected grey matter is indicated with yellow arrows.

