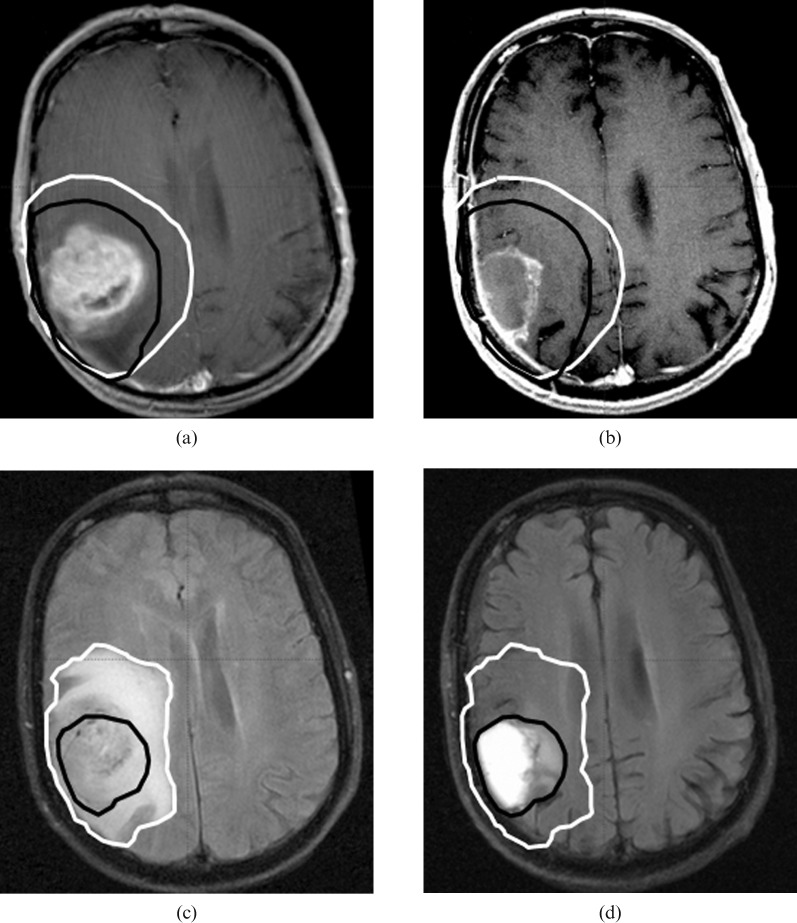
Figure 4.
Pre-operative (white line) and pre-radiotherapy (black line) Clinical target volumes (CTV) contours of patient 8. Representative sections of T1 pre-operative (a), T1 pre-radiotherapy (b), T2 pre-operative (c) and T2 pre-radiotherapy (d) show a decrease in CTV because of the reduced mass effect and reduced oedema.

