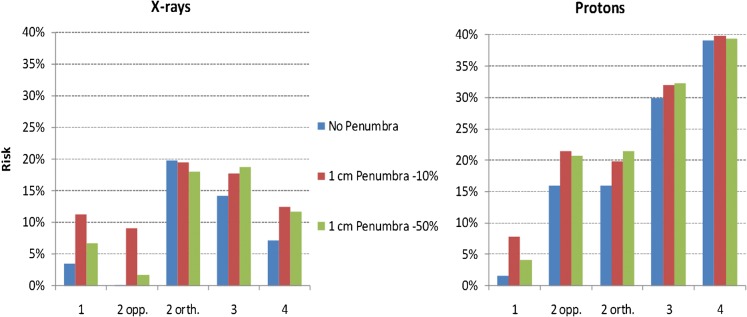
Figure 7.
Bar charts displaying the percentage risk of secondary malignancy for X-rays and protons using assumptions in Table 1 for each of the different field numbers and their orientations (as in Table 2) in the case of a centrally located planning target volume and where the penumbral dose is either absent or varies from 10% to 50%. The radiobiological and fractionation parameters are as given in Figures 5 and 6. opp., opposed; orth., orthogonal.

