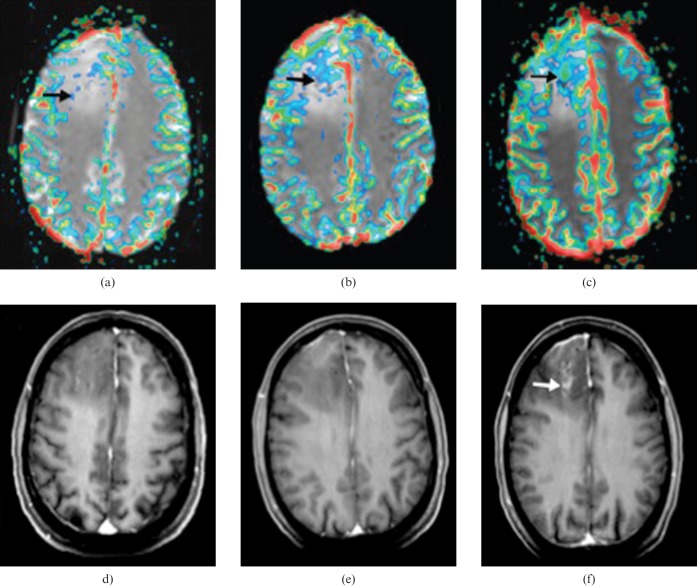
Figure 8.
Images from serial MR perfusion studies in 30-year-old patient with oligodendroglioma that showed progression to high-grade tumour 18 months after study entry. (a–c) Transverse rCBV (relative cerebral blood volume) overlay images. (d–f) Transverse reformatted images obtained with double-dose contrast-enhanced volumetric T1 weighted sequence (spoiled gradient echo; 14.4/6.4; inversion time, 650 ms). (a) rCBV map at baseline shows small area of elevated rCBV (arrow) measuring up to 4.52. (b) rCBV map 6 months before transformation shows larger area of increased rCBV (arrow) measuring up to 8.32. (c) rCBV map at transformation shows further increase in area with elevated rCBV (arrow), which now reaches a maximum value of 12.04. (d) Baseline contrast-enhanced T1 weighted image shows a hypointense tumour without pathological enhancement. (e) Six months before transformation, there is no evidence of pathological intratumoural enhancement, despite a markedly increased rCBV. (f) At transformation, there is irregular enhancement in centre of the tumour (arrow); the area of pathological enhancement is much smaller than the region of increased rCBV (reproduced from [115] with permission).

