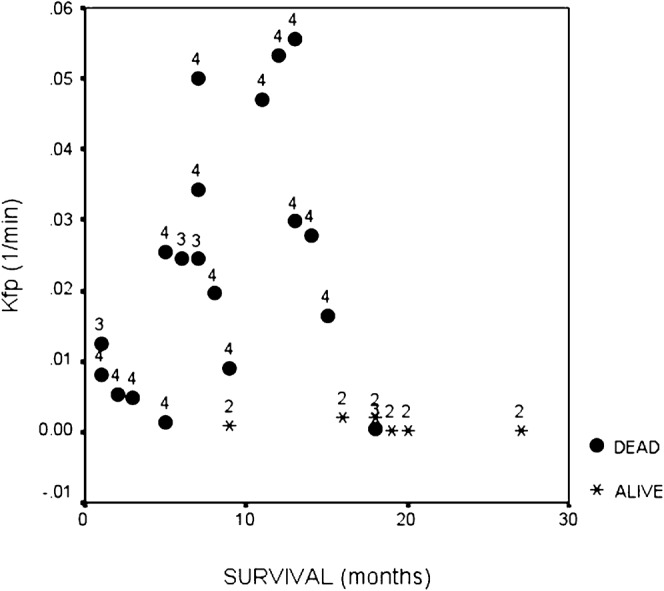
Figure 9.

Scatter plot showing survival in patients with high grade and low-grade glioma compared to measured Ktrans (extracted from first-pass analysis and termed Kfp). The figure shows a clear relationship between survival and Ktrans in high-grade glioma.
