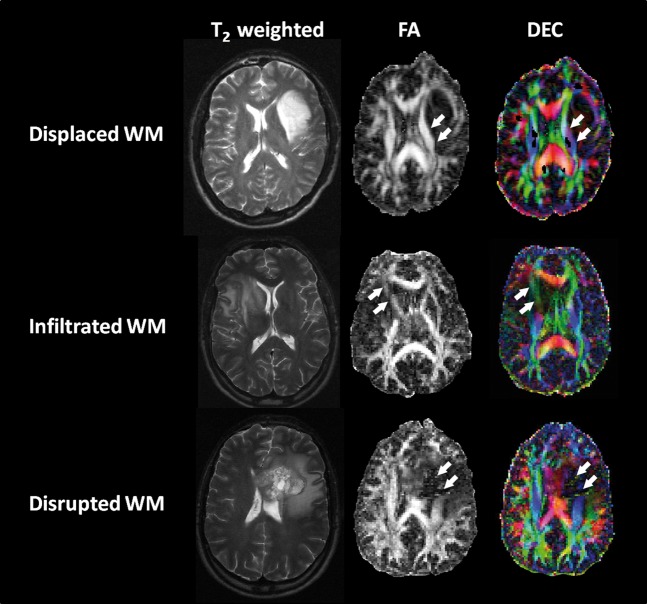
Figure 1.
Example of the use of diffusion tensor imaging (DTI) to understand the effect of the tumour on white matter (WM) tracts. The upper row shows a tumour deviating a tract (arrows). In this case the fractional anisotropy (FA) values are similar to the contralateral side but the directionally encoded colour (DEC) maps shows the tract colour is different to the contralateral side. The middle row shows tumour invasion of a tract (arrows). The tract can still be seen but with reduced FA and hue on DEC. The lowest row shows tumour disruption (arrows), where no tract can be identified on either method.

