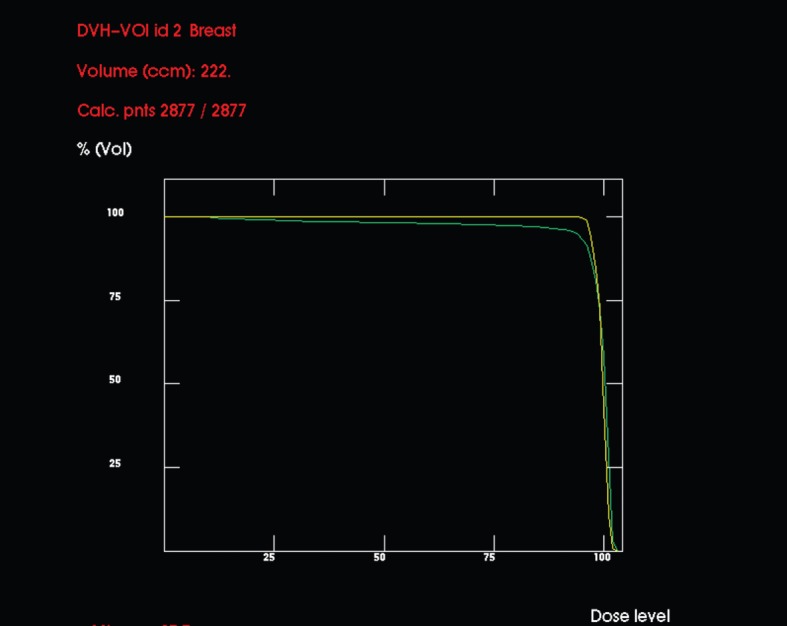
Figure 3.

Comparative dose–volume histograms (DVHs) (in dose percentages) for planned target volume (PTV) using the hypothetical standard (upper, yellow line) and institutional (lower, green line) set-ups. By conventional criteria, the distribution in the latter is poor, but the low-dose areas are well away from the tumour bed, so not clinically important.
