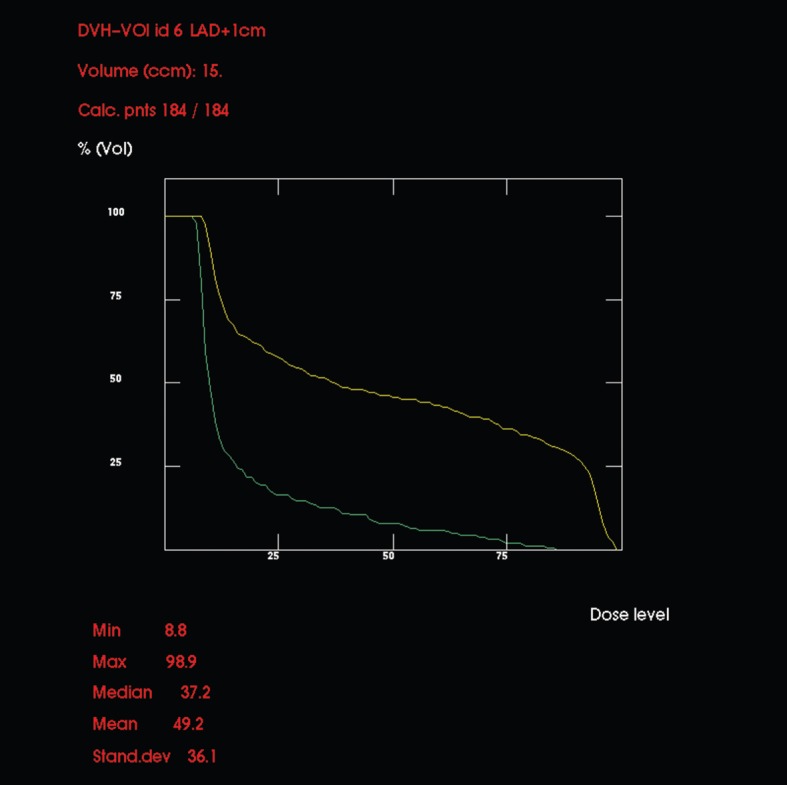
Figure 5.

Comparative dose–volume histograms (in dose percentages) for left anterior descending coronary artery (LAD) using the hypothetical standard (upper, yellow line) and the institutional (lower, green line) set-ups. Note that an arbitrary 1 cm margin was drawn around the LAD, so precise figures should be regarded with caution, but the relationship between the two lines would be similar regardless of the size of the margin used.
