
Figure 3.
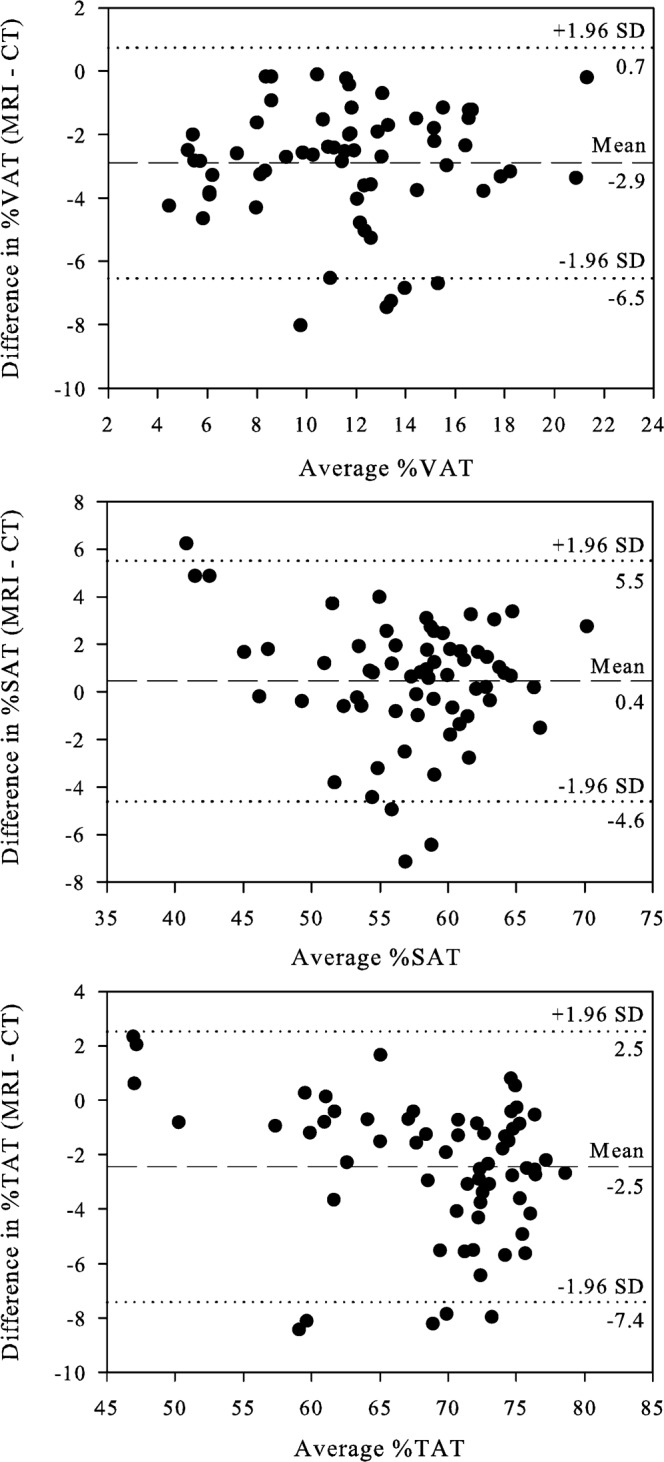
Bland–Altman plots: difference in MRI and CT measured adipose tissue at the level of the umbilicus for (a) visceral adipose tissue (VAT), (b) subcutaneous adipose tissue (SAT) and (c) total abdominal adipose tissue (TAT), expressed as percentage of total abdominal area. The outer dotted lines delineate the limits of agreement between the two methods.