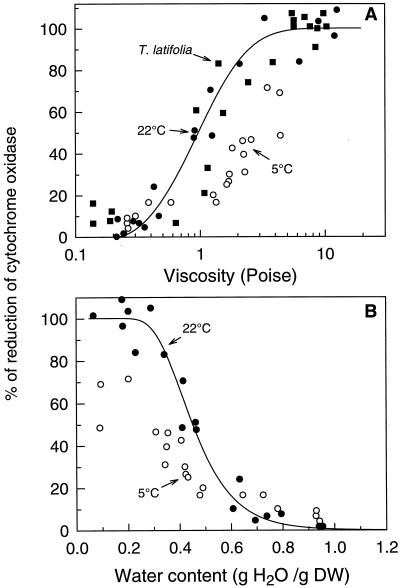
Figure 7.
The response of COX reduction to viscosity and temperature during drying of cowpea cotyledons (•, 22°C; ○, 5°C) and in T. latifolia pollen (▪, room temperature). Reduction levels are plotted as a function of viscosity (A) or as a function of sample WC (B). Viscosity values were taken from the equation fitting the viscosity versus WC plot of Figure 6A. The relation between viscosity and COX reduction in T. latifolia pollen is also shown. The curves represent fits (r2 = 0.915) to the control (22°C) experiments. DW, Dry weight.

