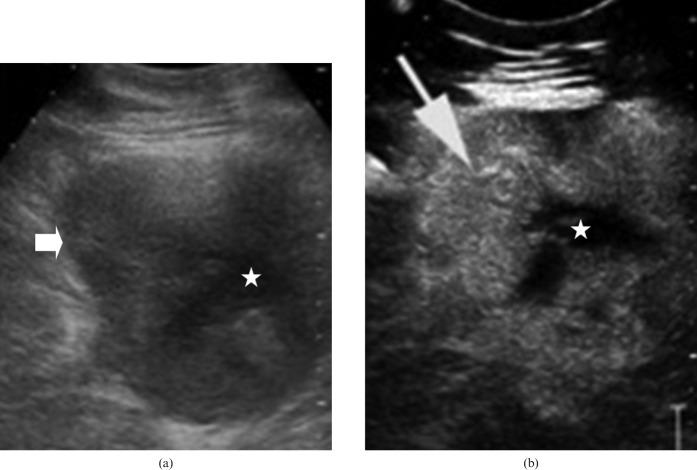
Figure 4.
(a) Greyscale ultrasound image shows a solid mass (arrow) with internal anechoic areas/debris in the region of pancreatic body (star). (b) Contrast-enhanced ultrasound image obtained in the arterial phase (20 s) shows marked enhancement of solid elements (arrow) leading to a hyperechoic appearance. Central cystic/necrotic elements are non-enhancing (star). Figure courtesy of Dr R Sinha, FRCR, FICR, MD, Warwick Hospital and Medical School, Warwick, UK.

