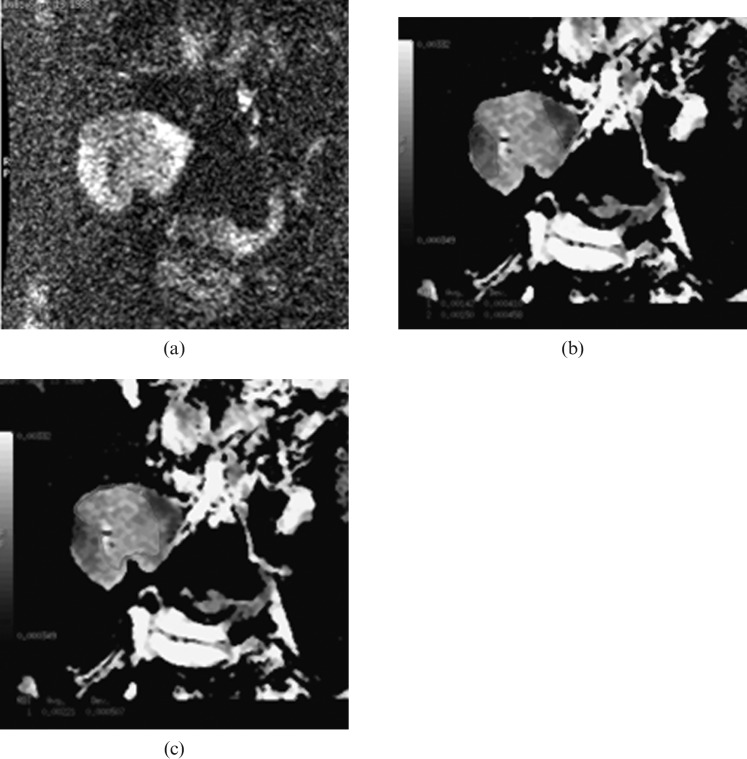
Figure 2.
Renal transplant recipient with normal kidney function. Diffusion-weighed images, 2 weeks after transplantation:(a) DW image at b=800 s mm−2 shows areas of high SI at upper (black arrow) and lower (white arrow) poles due to restricted diffusion secondary to ischaemic changes, (b) region of interest (ROI), applied to an ischaemic area. Its apparent diffusion coefficient (ADC) value equals 1.42 and 1.5×10⁻³ mm2 s−1. (c) ROI at the normal parenchyma shows ADC value of 2.21×10⁻³ mm2 s−1.

